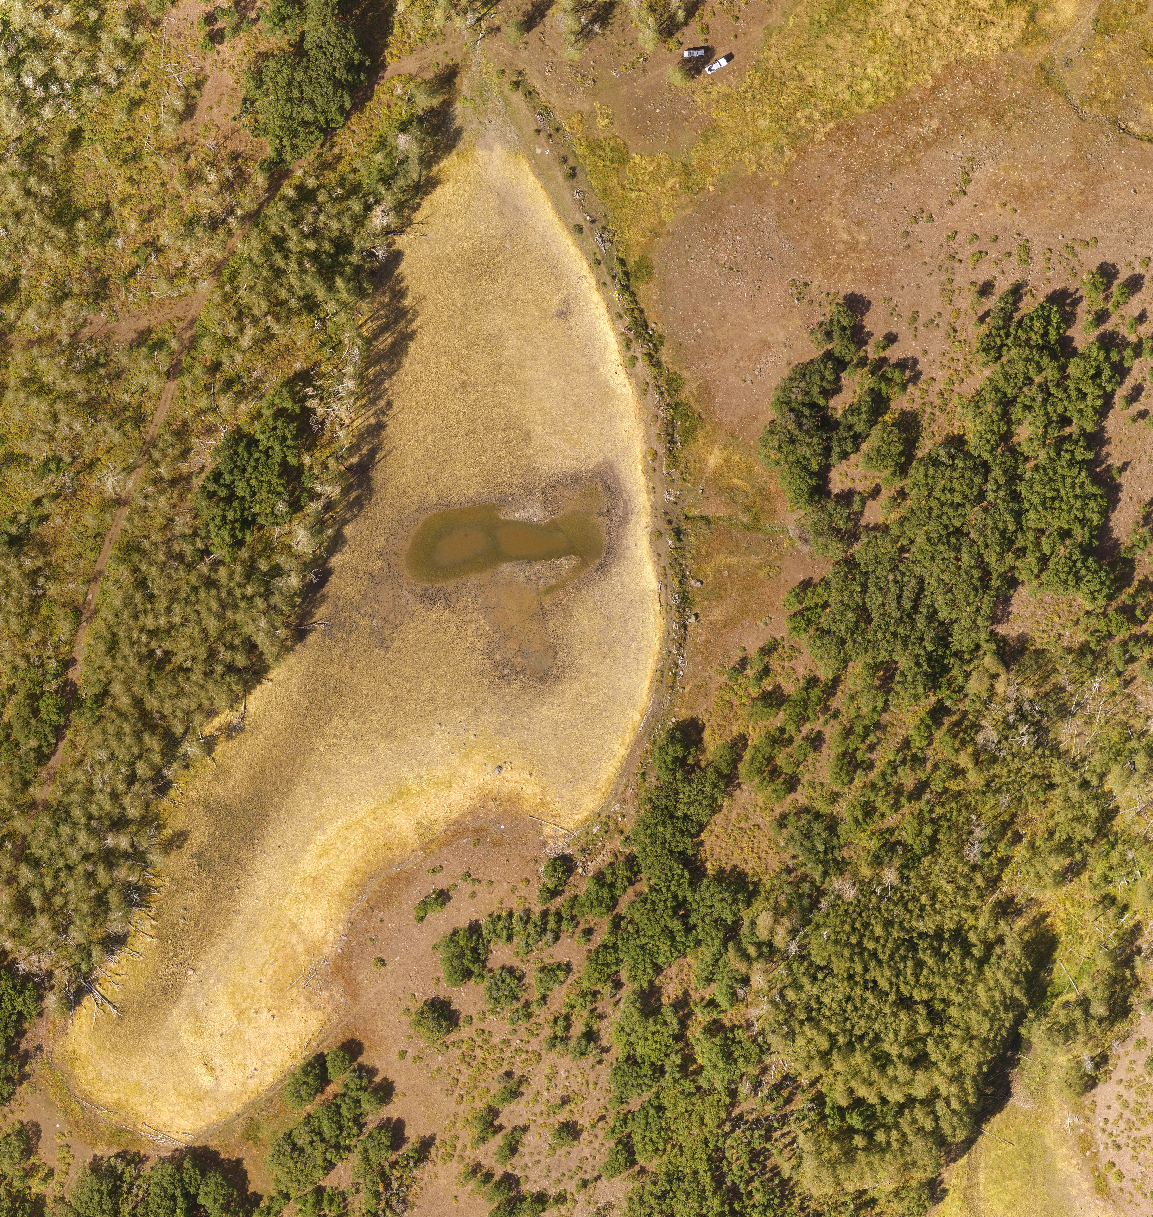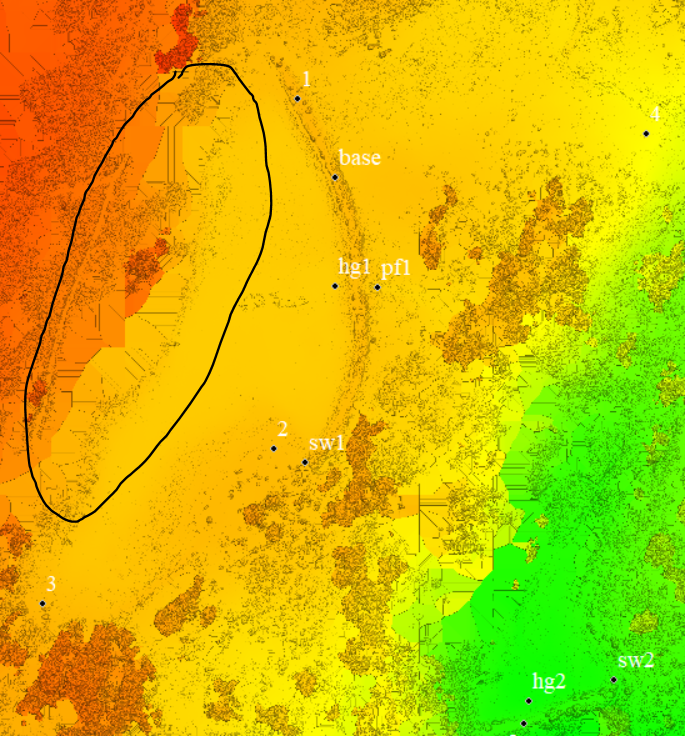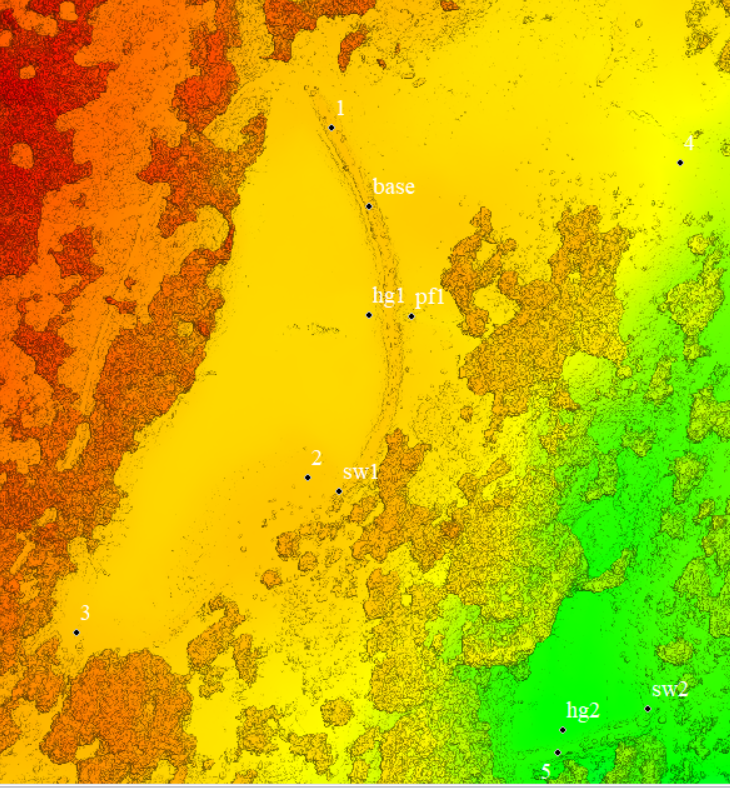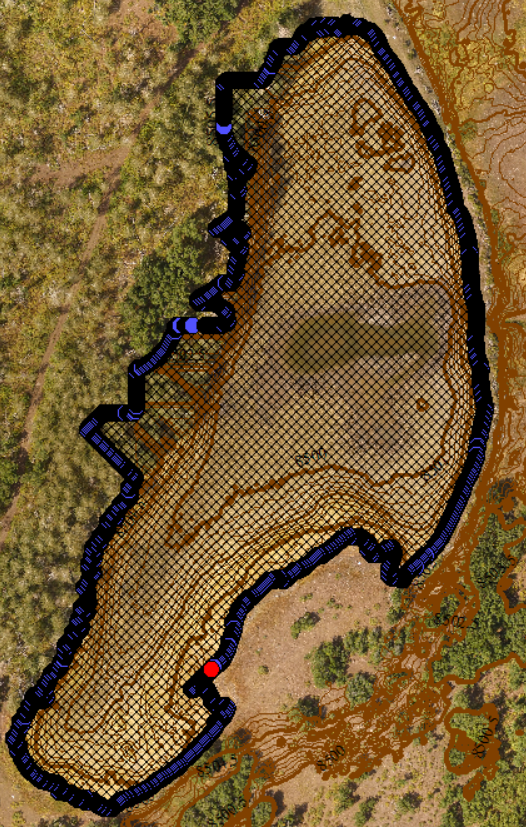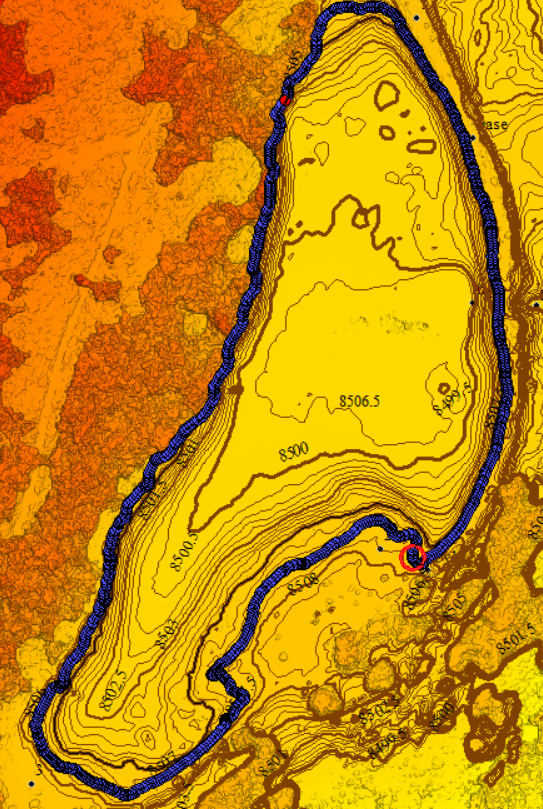
In the last few months DroneMapper has developed a terrestrial sensor (AquaBits IoT) focused on water resource management. This post describes our development, verification and capabilities for an affordable, real time device sensing flowing water in channels and continuous measurement of reservoir holding capacities. Previously we described the use of drone imagery collection, precision imagery processing and generation of reservoir basin contours from the DEM for water elevation correlation to storage capacity. This data can now be augmented with real time reporting of actual reservoir stage at any frequency of interest, with little latency to water managers.
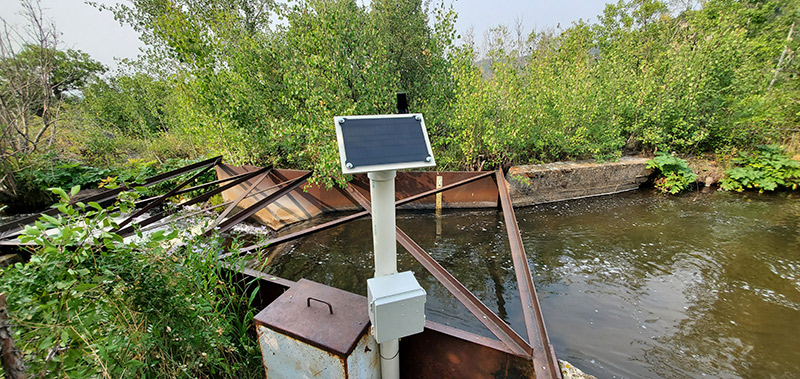
AquaBits utilizes accurate hydrostatic pressure measurement of the water column and is self contained inclusive of a power subsystem and communication capability using either cellular (when available) or satellite for remote locations. Data is transmitted to our secure dashboard where it is archived and processed for discharge in a flowing channel or current water stage in a reservoir. A slide deck with an overview of AquaBits and recently collected data compared to Colorado State instrumentation can be found here: (pdf attached)
In other scenarios when equipped with the appropriate sensor(s), applications to consider may include soil nutrient/moisture measurement for agriculture, earth subsidence/movement, chemical contamination, water quality, audio/visual surveillance, limited only by the imagination... Feel free to contact us and discuss your specific application.
The DroneMapper Team
aquabits.io