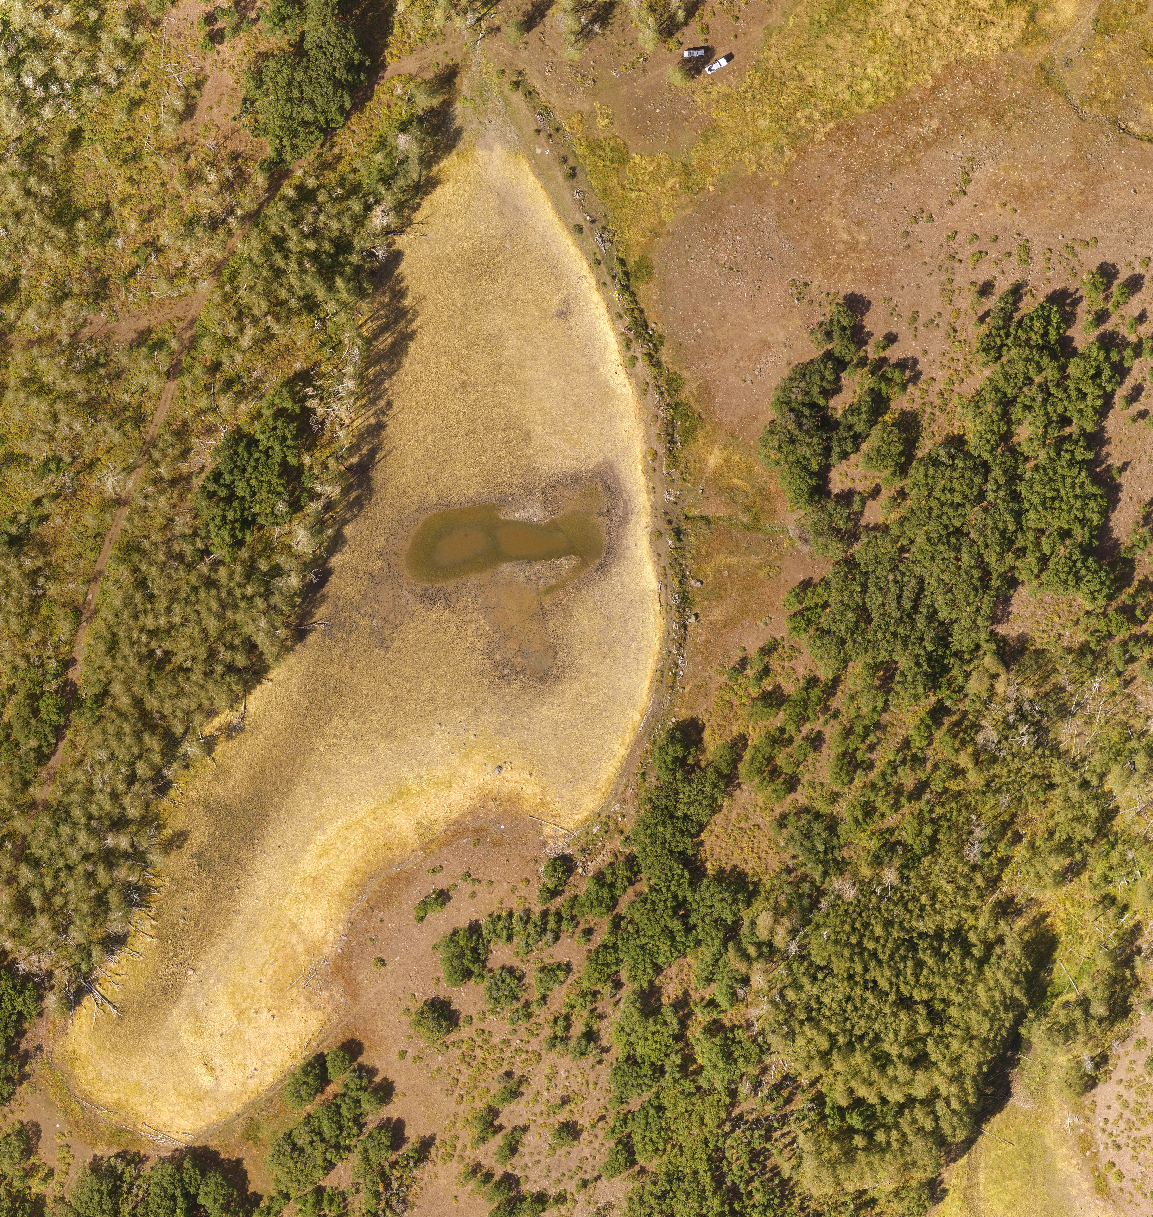
Figure 1
It's that time of the season again where water resource managers are checking their emptied reservoirs for possible silt-in and verification of water holding capacities. We recently flew one of these reservoirs on the south side of the Grand Mesa in western Colorado with our Phantom 3 and a set of ground surveyed aerial targets. The imagery and control were processed using two different DEM generation algorithms, the results of which are presented and discussed here.
Figure 1 illustrates the ortho of the area with the ground surveyed targets and other points depicted as black dots. Figure 2 shows the DEM construction using our standard algorithm. The black oval highlights DEM decorrelation where the vegetation and shadows obscure the NW bank of the reservoir causing erroneous elevation rendering. Figure 3 shows the DEM construction utilizing the max flow/min cut DEM algorithm with greatly enhanced correlation in the same area previously highlighted.
We use Global Mapper to generate contours at specific elevations of interest ranging from reservoir drain or dead pool to maximum capacity or spill elevation. Each contour generated is converted to a flat water elevation surface and the volume between that surface and the DEM reservoir surface is computed. Take a look at what happens when contours are generated on a locally decorrelated DEM in Figure 4. One can see the contours are moving into the NW vegetated area which produces higher volumetric and surface area estimates than reality. As a comparison Figure 5 using the Max/Flow/Min Cut algorithm demonstrates more accurate rendering of the contours and subsequently higher accuracy volume estimates.
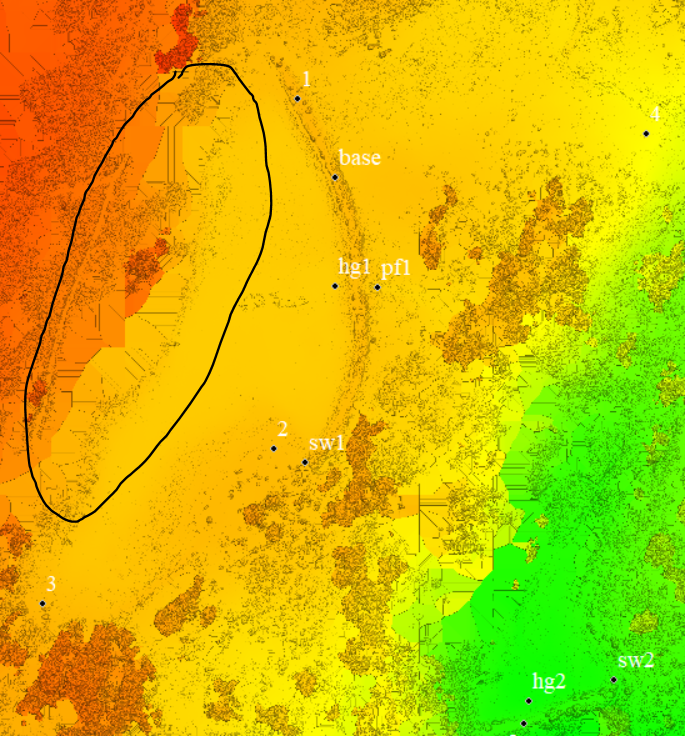
Figure 2
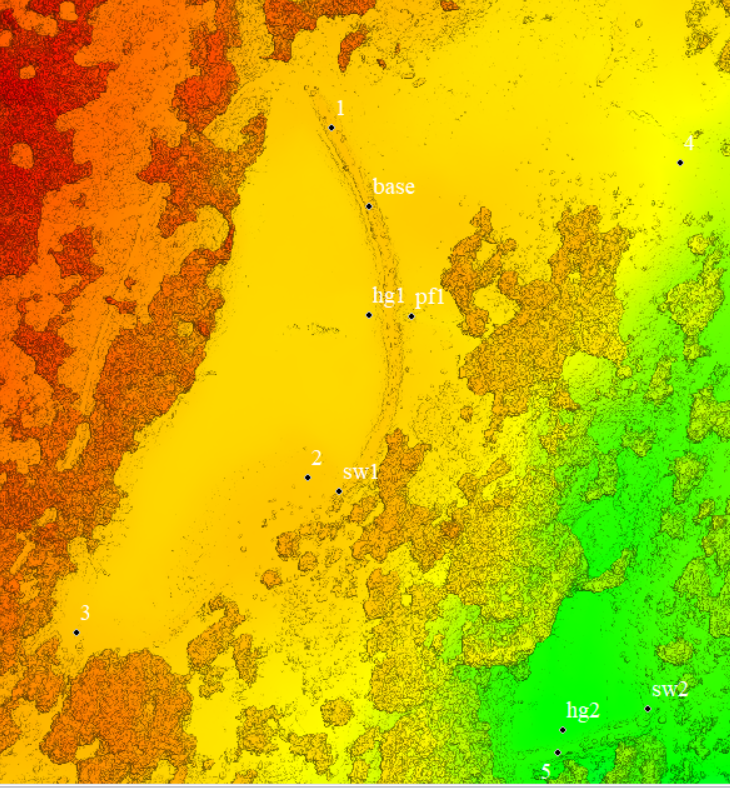
Figure 3
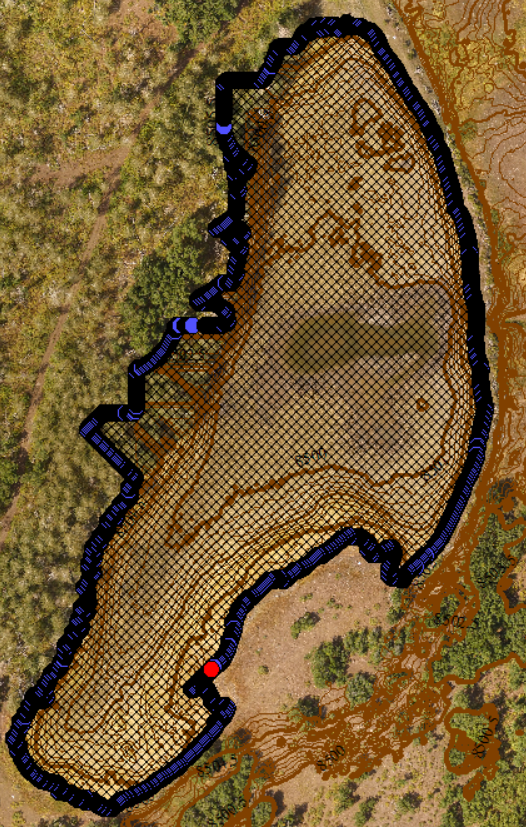
Figure 4
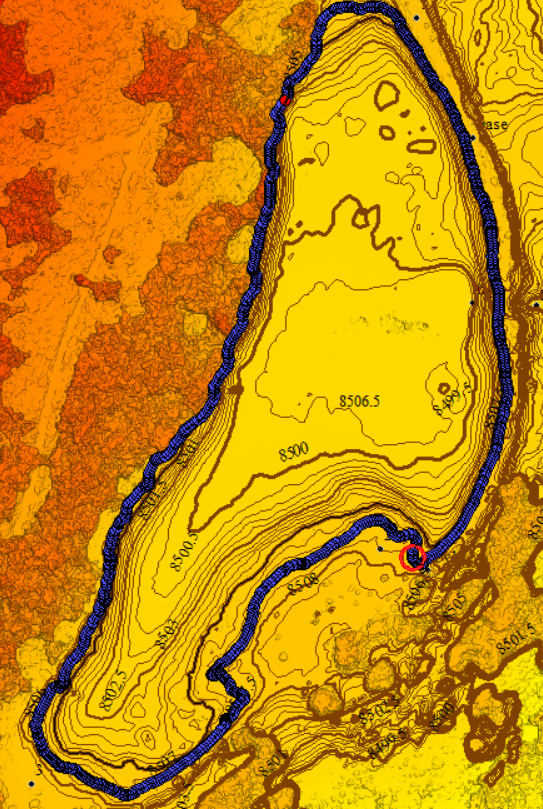
Figure 5