Pierre Stoermer, CEO – DroneMapper.com
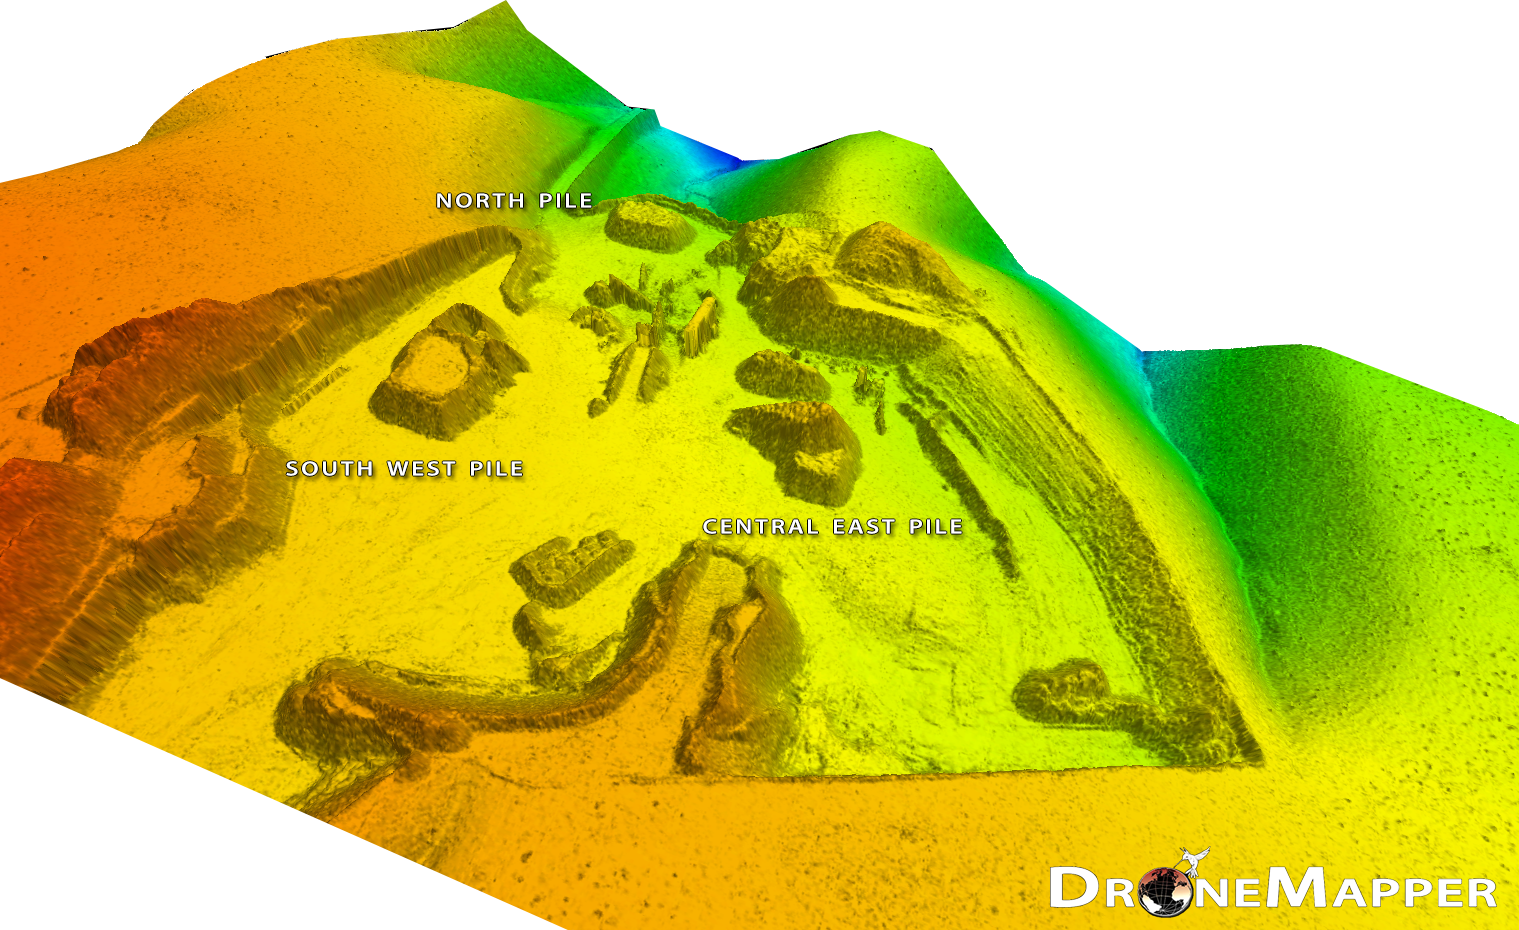
We utilized Globalmapper (GM), version 16.1, to determine stockpile volumes for the BLM gravel pit example. A Canon SX 260 HS was used to collect 240 images at a ground sample distance of 3.2 cm. Dronemapper processed the imagery generating the geo-referenced orthomosaic and DEM for the scene. For this analysis we imported the DEM into GM and performed volumetric estimation of three stockpiles. The three piles are identified in the DEM image below.
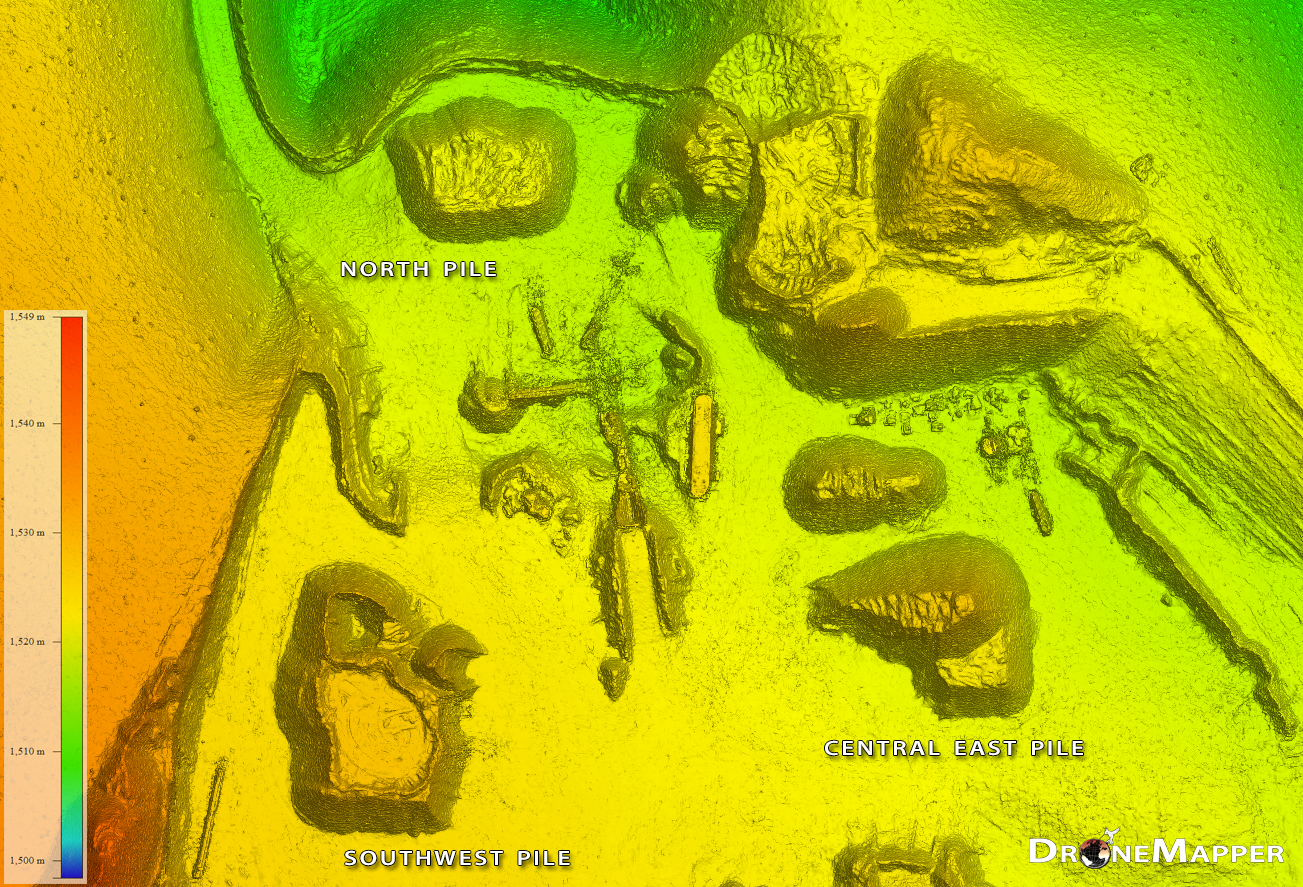
After importing the DEM the digitizer tool was used to generate an area at the base of each of the stockpiles. Once the pile areas were defined we applied elevations from the terrain to each of the three pile areas. We then computed pile volumes. GM generates a flattened terrain surface (reference) beneath the pile and a pile surface. The difference between these two 3-D surfaces computes the volume of the pile. The table outlines the measurements made on each pile.
| Pile Name | Total Volume (m3) | Cut Volume (m3) | Cut Area (m2) | Cut Area 3-D (m2) |
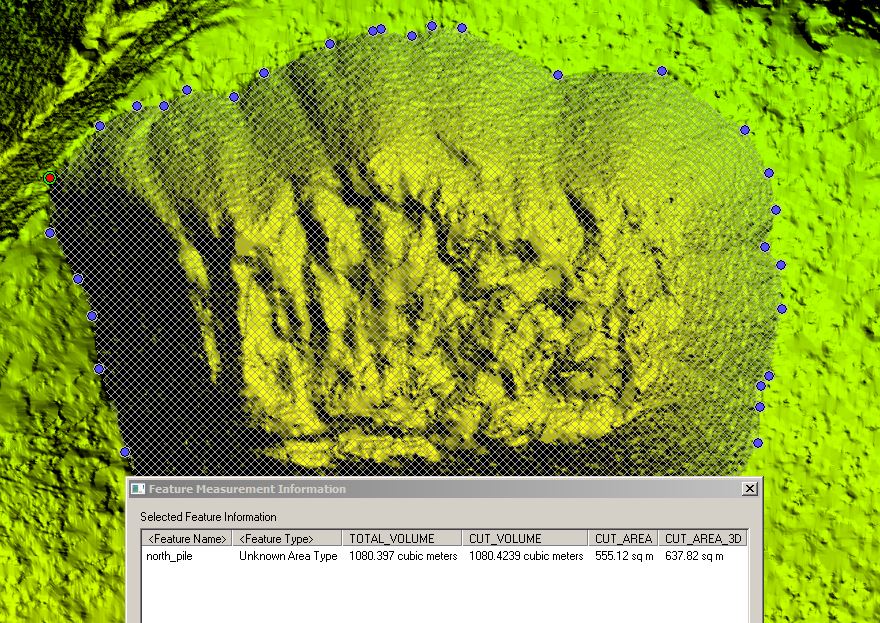
| North Pile | 1080.397 | 1080.424 | 555.12 | 637.82 |
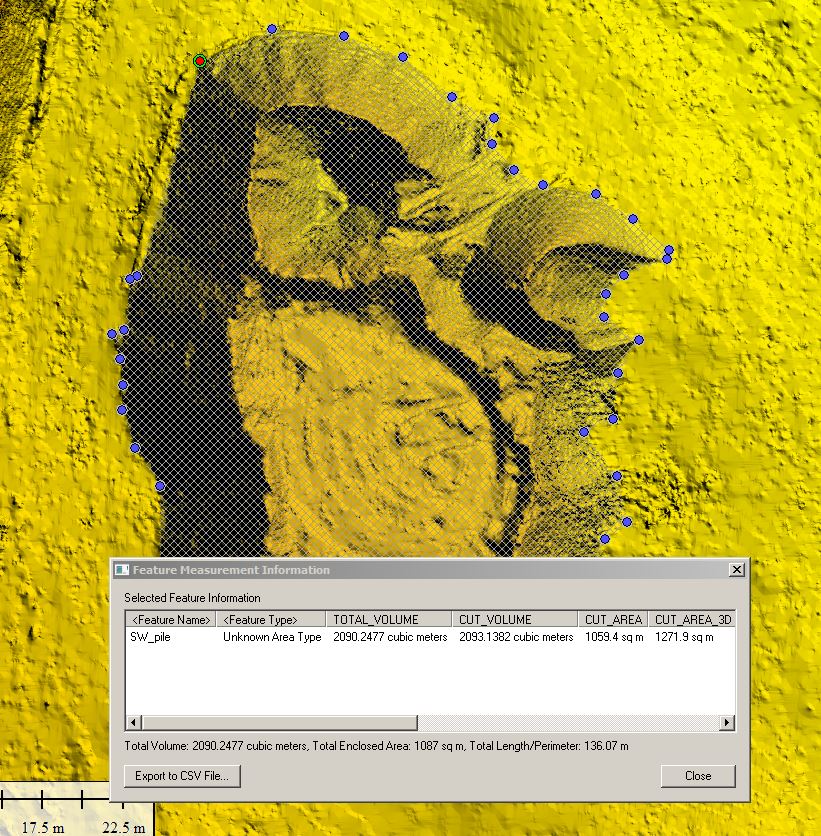
| South West Pile | 2090.248 | 2093.138 | 1059.4 | 1271.9 |
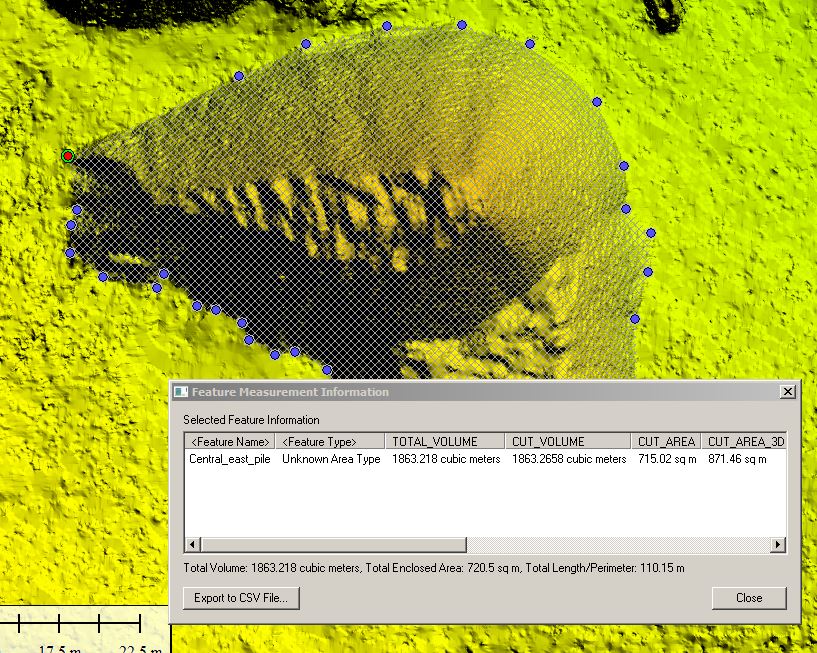
| Central East Pile | 1863.218 | 1863.266 | 715.02 | 871.46 |
The three measurements are illustrated in the next three screenshots. The last screenshot shows a 3-D view of the identified piles that were measured to give the viewer perception of their relative sizes. Besides cut volumes, GM also performs fill volumes, valuable for the mining and construction industries.
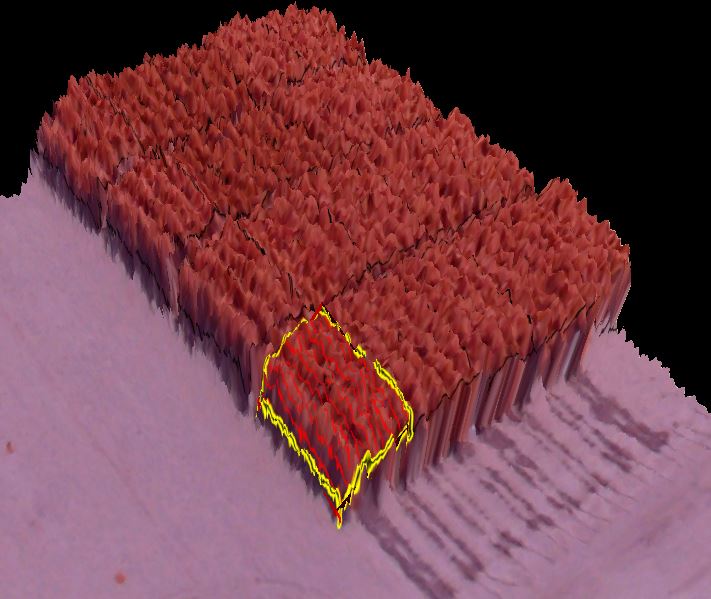
This same technique can be used for estimating above ground biomass for crops. A section of a 3-D model of a research corn field is illustrated below. Imagery was collected at 5 cm GSD in the NIR. One of the plots within the field is identified with a plot shapefile (in yellow). The average plot height was estimated at 216 cm using the volume and area generated by GM. In this case we could not utilize two 3-D surfaces to compute the volume since adjacent plots obscured the terrain below the plot of interest. Instead, we used a fixed mean elevation of the terrain as the reference to compute the volume of the plot’s 3-D surface.
We will be working with precision agricultural specialists this growing season to track a set of crops/fields on a weekly basis. The DEM will be generated for each imagery collection of the crop through the growing season. Biomass volume estimation will be computed for each collection for all of the plots in the field. Plot biomass accumulation will be tracked weekly, statistically analyzed and correlated with plant genetics, field treatments and other phenomenology collections. We hope to report on this by the end of this year – so stay tuned!